Semantics

This will probably be the last post here for the DITA module, although I hope to keep the posts going post-DITA too. I thought I’d use this one to address some semantics. Last week’s lecture was about the semantic web and initially I thought it might be a good idea to lay down in my own words, and in as concise a way as possible, what is meant by some of the terms we looked at. There were quite a lot and as I went on I ended up adding things encountered in previous lectures as well. Most of these were jotted down on a piece of paper on a long train journey on Sunday, and while I haven’t generally (apart from one) directly referenced any other sources below, they will inevitably be a paraphrase of the words of others [at least I hope they are paraphrased and not the exact words of anyone – apologies if so] – not least Ernesto, our DITA lecturer, and David and Lyn our LISF lecturers. The definitions are maybe not overly objective – more Samuel Johnson than the OED in places. They may also be wrong… please feel free to disagree, question, or correct anything here.

A DITA Dictionary

Semantic Web – The idea of the semantic web perhaps reflects the structure/process of human knowledge, where meaning exists in terms of a relationship between one thing and another. It is an idea not yet (fully) realised. One way the idea might be realised is by tagging: defining possible relationships in a machine-readable format. BUT while there are some agreed objective connections between things, there are many more (infinitely more?) personal ones, or domain specific ones, or cultural ones, etc… – all of which may agree with, or disagree with, or contradict the others. Can a system of human-imposed tagging ever hope to deal with, let alone replicate, the complexity of this?

XML – eXtensible Markup Language. A loose set of agreed conventions for tagging (/describing) content of a given text in a way that machines can read (although it is often readable to humans too). It can be, and is, modified to different needs and subject specific vocabularies. Its rules, once set up, must be observed (most importantly closing all tags with a ‘/’ – i.e. <name> Carol Channing </name>).

HTML – HyperText Markup Language. A set of agreed conventions for describing format in a web-published document, designed to be read and reinterpreted by a given web browser. It is a bit less strict than the XML rules (you don’t need to close opened tags).

The World Wide Web – Tim Berners-Lee’s concept for a connected web of knowledge, based on the internet and hypertext.

Web 1.0 – vanilla flavoured web. Static documents, albeit connected by hyperlinks.

Web 2.0 – a living web of information, allowing user interaction with and generation of content.

Web 3.0 – the future? the semantic web is sometimes called Web 3.0, and sometimes Web 3.0 is thought to be the ‘semantic web’.

Web Service – cheating on this one – definition from W3C:

“a software system designed to support interoperable machine-to-machine interaction over a network.”

…Twitter and Facebook are examples.

API – Application Programming Interface.  Something that allows access to the data within a given system (Twitter, for example), in a way that doesn’t require extensive technical knowledge.

Altmetrics – ‘alternative metrics’. Metrics are measurements which within an academic research context are usually of ‘impact’. Traditionally this might have been a measurement of the citations an article receives. Alternatively, this could be done as a measurement of impact across a wider scope – ‘mentions’ (i.e. an embedded link) in tweets, for example.

Distant Reading – Franco Moretti’s idea of analysing a broad corpus of works to draw more contextual conclusions than are traditionally drawn from the ‘close reading’ of individual, usually ‘canonic’, works.

Ontology – the overriding rules that govern a given system (slightly different to philosophical use).

Taxonomy – an instance of an ontology. The words, categories and classifications to be used to describe and order things in a hierarchy.

Data Mining – digging for, and extracting, data from something that doesn’t readily present it otherwise.

Text Analysis – a form of data mining. Take a body of text and see what quantitative conclusions can be drawn from it.

Information Architecture – information requires structure, and different structures in different situations. The design of this structure is the architecture.

Databases – places to store data in a retrievable and usable way. Relational databases allow connections between related data of differing types.


There are a few I’ve missed out here, particularly more technical things (RDF, URI, XML Schema, JAVA, JSON, OWL spring to mind). I think I need to think about these a bit more myself – and there are neat enough summaries on Wikipedia anyway. In conclusion though I thought I’d have a go at the seemingly ‘must-do’ definitions within LIS – the classic Information-Knowledge-Data-Document set. Once again, these are strongly influenced by reading and lectures, but particularly Luciano Floridi, Lyn Robinson, David Bawden, Ernesto Priego and Tim Berners Lee.


Information – an interpretation of knowledge, translated into a given communication system (words, sound, code, etc.) for the purposes of transferring something from A (that knows it), to B (that doesn’t).

Knowledge – meaning and understanding. Created through having interpreted information presented by an external source, and then connected to existing knowledge.

Data – unprocessed things that have been collected and are awaiting meaning.

Document – a record of information. What can be defined as a document will vary depending on the context of encountering it.

Posted in DITA | 2 Comments

Data Mining – an exercise

This post is a write-up of the exercise set in the DITA lab session on Monday, looking at and comparing two projects that provide access to digital versions of material. The access these, and others, provide differs just as the data being accessed varies widely, but in most (all?) cases they offer the potential to perform quick and easy mining on the data presented – whatever form that may take.

The first project we looked at was Old Bailey Online, this allowed searching across the digital transcriptions of all the proceedings of the Old Bailey from 1674 to 1913. A well laid out site, with clear navigation, the search function was similarly intuitive to use. Free-text fields for keyword (plus options of Boolean operators), ‘surname’, ‘given name’ and ‘alias’ are complimented (and can be combined with) drop down lists of controlled vocabulary for ‘offence’, ‘verdict’, ‘punishment’ and choice of source text. A date range search box rounds off the options.

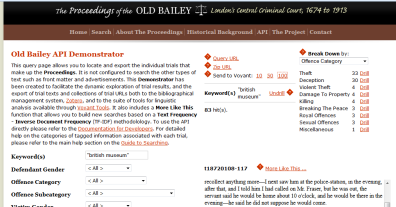
The Old Bailey Online project also offer an API (Application Programming Interface) to access and mine the data in a slightly different way. Rather than providing a list of the documents that fit the search parameters given, the API allows you to view the search results as a whole, from a broader perspective. So, from my initial search for the phrase “British Museum” I could choose to see how the resulting cases divided between gender, types of punishment or, as in the screen shot below, type of crime.

Old Bailey API

From here you can choose to ‘drill’ deeper into the results, or to see the details of the individual cases that fit the criteria. This differs from the main search function, which, once the search filters have been applied, only provide a list of individual cases to be looked at individually.

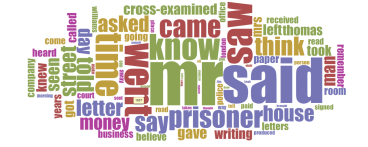
Another aspect of the API is that it allows you to export your results to Zotero (the free research management tool), or Voyant Tools (the text analysis tool I looked at in my previous post). I did this with my “British Museum” crimes dataset, and produced another word cloud with the results. With such a large data set, I would need to spend time refining (‘stop words’ etc.) to get any really meaningful results – although a casual glance at this does show that ‘Mr’ appears more frequently than ‘Mrs’, and that of all names, ‘Thomas’ seems to crop up among the proceedings the most often.


Old Bailey British Museum

However, data visualisation tools only really give an impression of reality, as abstracted from the given data set and, as with any statistics, the data can easily be tailored to present the particular picture you have in mind. I don’t just mean a cynical manipulation by corporate powers/governments etc. to present biased propaganda: I suspect it is easy for us all to see a certain correlation in such things, run with it and end up drawing conclusions that reflect the given chart/cloud/data, but not (necessarily) reality. That said, visualisations are a useful way to represent ideas, and often have more power than a text-based argument – I suppose they (by which I think I mean tools generally) just need to be used with caution, supplementing but not driving research.

After this we were tasked with identifying a project from the Utrecht University Text Mining site. I chose Annotated Books Online (ABO), as it sounded interesting (documenting books with annotations by their previous owners) and fitted in with my day-to-day work (people are always researching marginalia and annotations in early printed books in the Rare Books & Music reading room). The YouTube video below gives a bit of background to the project and its rationale.


Leaving aside the content, ABO differed from the Old Bailey Online project by its focus on metadata rather than content – whereas the Old Bailey site focused on searching the documents themselves, ABO only allows you to search the information about the item. However, it is an ongoing project, and its real benefit (aside from preservation of the original 15th/16th/17th century books) lies in the ability for users of the site to add annotations to the annotations – providing translations, clarifications etc. that can then be searched themselves. What seems to be happening is that the relatively quick and easy task of providing digital images of the original items has been done, while the harder task of encoding the information so it can be read by digital technology has been opened up for everyone to participate. While there are obviously issues with editorship here, these are offset against the benefits offered by the breadth of knowledge being drawn from, and the possibility of the annotations growing far from their fixed form of the original – debate, alternative readings and translations are all possible.

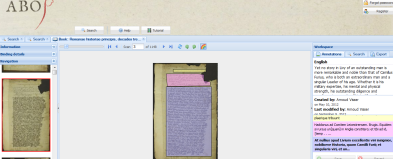
Here is an example, from a digitisation of Princeton University’s copy of Romanae historiae principis, Basel, 1555 – owned (and annotated) by Gabriel Harvey.

ABO annotations

The trouble with a lot of these projects though often seems to be the limited scope and time-scale (usually seemingly related to the duration of a research grant). It would be good to see ABO expand as its potential usefulness is great, but at the moment it doesn’t have a huge amount of content, and the added digital annotations seem to have primarily come from specifically funded projects around specific books or owners (as in the Harvey example above).


Posted in DITA | Leave a comment

Exploring some tools for text analysis

Following on from last week’s lecture on text analysis, and its accompanying lab session looking at digital text analysis tools, I am presenting here a few observations about three of these that we played (or ‘screwed’ to use Stephen Ramsey‘s terminology) around with.

‘Text analysis’ is a fairly broad term that does what it says on the tin, however in recent years it has tended to be used most in relation to activities connected with analysing digital representations of texts – their structured forms allowing for easier and quicker coverage of wider data sets than had traditionally been possible. As an instance of data mining, the results from such analyses can be used to infer certain conclusions, usually at a broader, contextual, level than traditional ways of reading texts – Franco Moretti’s ‘distant reading’, as opposed to the conventional ‘close reading’.

We looked at three web-based tools for undertaking text analyses – ‘Wordle‘, ‘Many Eyes‘, and ‘Voyant Tools‘. All three had in common their ability to produce the ubiquitous ‘word cloud’ from a ranking of the number of appearances of certain words.

I started by using the data set extracted from Twitter using an app developed by Martin Hawksey that accessed the Twitter API and collected the data in a Google spreadsheet. My search then (several weeks ago now) was for the hashtag #BLGothic – being used for the then newly opened Gothic literature exhibition at the British Library.

The content of the tweets collected was fed into each of the three text analysis tools, and used as the basis to experiment with each, finding out what each was capable of.

From ‘Wordle’:

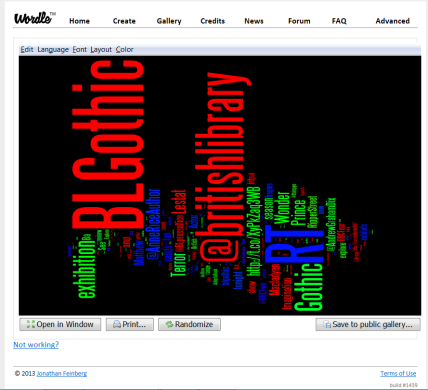
Placing the whole of the text into the box I was invited to place it into, and clicking ‘go’, produced the following word cloud. Predictably, there were certain functional words that appeared a lot more than others – notably the hashtag I’d searched for in the first place, the Twitter handle for the British Library, the retweet abbreviation (RT), the word ‘exhibition’ and the word ‘Gothic’.

BLGothic1 wordle

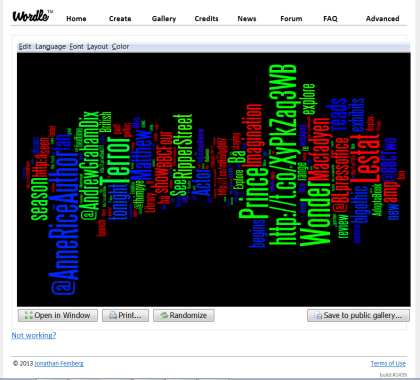
I couldn’t imagine the presence of those helping to draw any particularly useful or interesting conclusions, so they were removed (simply clicking on the chosen word and asking for its removal takes it away).

BLGothic2 wordle

Very nice. Anything else you can do with Wordle though? Change the colour maybe?…

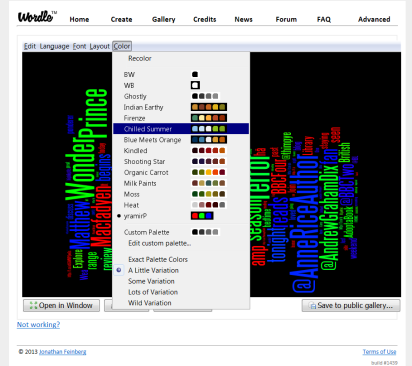
BLGothic3 wordle colour

… or the layout and look of the word cloud?…

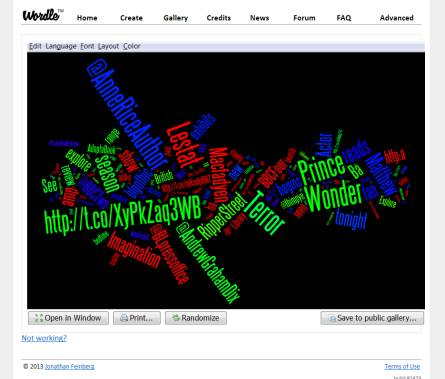
BLGothic4 wordle

That’s about it, it seems. A quick and easy tool (to be fair, it is actually described as a ‘toy’ on its own homepage) to produce a word cloud, if that’s what you need to do. Fine.

From ‘Voyant Tools’:

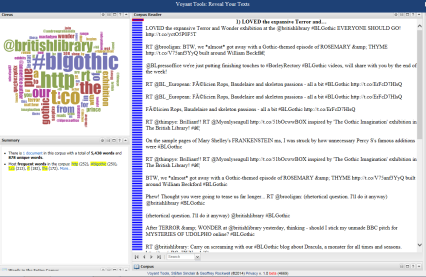
This had more options, although the default was once again the word cloud (or cirrus as it was called here), it also provides a summary list of the numbers of appearances of words (bottom left hand window), and larger window with the whole of all the data. Hovering over each word gives the total appearances in the text as a whole. ‘Stop words’ was the term used to exclude certain strings of characters from the final processing – Voyant Tools helpfully had pre-loaded lists of the kinds of things you probably wouldn’t want included, and these could be edited to include others. It was interesting how it broke down certain strings in a different way to Wordle though – ‘http://&#8217; and ‘t.co’ being considered separately to the rest of the URL.

Aside from the word cloud, it is possible to produce graphs showing trends of individual words, or words in combination, within segments of the data set.

BLGothic Voyant tools1

From ‘Many Eyes’:

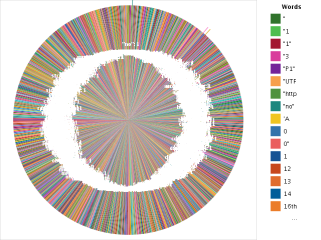
The final tool we looked at was IBM’s ‘Many Eyes’. I found this by far the most frustrating – requiring sign-up for one thing, and a slow and irritatingly slick (but devoid of interest) interface. Here other types of chart could be produced to show distributions of words, although, as far as I could tell, little or no refinement was possible (you presumably would need to have done this first). My #BLGothic dataset did not produce very interesting results, so I thought I’d pop in all the words from all the posts so far on my blog and show their distribution in the form of a pie chart. The results demonstrate another side to this analysis tools – as producers of data visualisations for their own sake, and the consideration of those visualisations as art.

words in my blog


Posted in DITA | Tagged , , | Leave a comment

Discovering Altmetrics

A quick post about Altmetrics, which we looked at in the DITA lecture and lab session this week. Alternative metrics (to give them their full name) are an alternative to traditional metrics. Traditional metrics, within an academic research context, tend to focus on quantifiable measurements, most often the number of citations an article receives in other articles. Alternative metrics are based on the initial premise of measuring something more qualitative: the social impact that the article/research might have. As well as this change in emphasis (or perhaps because of it), the scope of the statistics is widened, from the relatively narrow outlook of the discipline, or related disciplines, the article sits within, to a much wider, potentially global community. The measurements are primarily made (or collected anyway) through ‘mentions’ (a mention being defined as a link to the article embedded in a text) on various platforms – from broadcast media through to Twitter, Facebook and others.

A manifesto (always a welcome thing) by the instigators of the idea, setting out their vision for what altmetrics can be, can be found here. In this they also, with admirable honesty, present the notable question mark that hangs over how helpful altmetrics ultimately might be –

“Researchers must ask if altmetrics really reflect impact, or just empty buzz.”
[http://altmetrics.org/manifesto/ ]

Just because something is ‘mentioned’, it obviously doesn’t follow that it either has really had an impact (the author might just have lots of friends who have helpfully shared their work – or, more cynically, the services of a ‘click farm’), or that what has made an impact is necessarily the most impactful work in the field (there could be other research, less well publicised, sitting out there, unread). While the scope of the counting in this form of metrics has undoubtedly been widened, the fact remains that counting is still taking place – it is just based on a different form of citation.

Companies such as Altmetric, which we used the services of in the lab session this week, have developed, and continue to develop, the tools required to manipulate and use this data, and it’s clear that this is a path that should be followed (the idea that metrics taking into account a wider scope of impact should be thought of as ‘alternative’ at all seems quite incredible: it will surely become the ‘standard’/’traditional’ way fairly quickly, if it hasn’t, in some disciplines at least, already). Tools to analyse the context of the sharing – the semantic content of the tweet, post, article etc. – will greatly enhance what can be done, and (importantly) the validity (real or perceived) of the results that come out of it.

As I found in the lab session, at the moment, while they clearly havn’t reached their full potential, ‘altmetrics’ are very useful as another tool (but not the only tool) to find information, and to find that information in a different way. Once they have fully reached their full potential they will surely lose their first three letters and become just ‘metrics’ – they will be the norm. Going back to that manifesto again, which I really did  quite like:

“No one can read everything.  We rely on filters to make sense of the scholarly literature, but the narrow, traditional filters are being swamped. However, the growth of new, online scholarly tools allows us to make new filters; these altmetrics reflect the broad, rapid impact of scholarship in this burgeoning ecosystem. We call for more tools and research based on altmetrics.”

http://altmetrics.org/manifesto/

Posted in DITA | Tagged , , , , | 3 Comments

A brief aside on MusicXML

My interest was piqued in this week’s DITA lecture (not that my interest isn’t always piqued in DITA lectures of course) when mention was made of elaborations and developments that can be made to XML (eXtensible Markup Language) for different purposes. XML, we learned, is a language used to describe content in a document (HTML, which we looked at in previous weeks, is for describing layout). While this is text based, it can be used to describe all sorts of things, including, it seems, music notation. This triggered a distant memory of someone mentioning MusicXML to me, and me not understanding what the person was talking about. Now, it makes more sense – I’ll say a few things about it below, which will hopefully help get things/concepts etc. straighter in my mind. Apologies for anything that states the obvious – and for anything I’ve misunderstood and gone and represented as a fact (always grateful for observations/corrections…!).

Below is the MusicXML equivalent of ‘Hello, World’, with the end result and the information that created it. This comes from the MusicXML website, which has plenty of info and description of how the language works.

————————————————————————————————

from http://www.musicxml.com/tutorial/hello-world/

“In MusicXML, a song with the lyrics “hello, world” is actually more complicated than we need for a simple MusicXML file. Let us keep things even simpler: a one-measure piece of music that contains a whole note on middle C, based in 4/4 time:

Whole-note middle C in 4/4 time, treble clef

Here it is in MusicXML:

<?xml version="1.0" encoding="UTF-8" standalone="no"?>
<!DOCTYPE score-partwise PUBLIC
    "-//Recordare//DTD MusicXML 3.0 Partwise//EN"
    "http://www.musicxml.org/dtds/partwise.dtd">
<score-partwise version="3.0">
  <part-list>
    <score-part id="P1">
      <part-name>Music</part-name>
    </score-part>
  </part-list>
  <part id="P1">
    <measure number="1">
      <attributes>
        <divisions>1</divisions>
        <key>
          <fifths>0</fifths>
        </key>
        <time>
          <beats>4</beats>
          <beat-type>4</beat-type>
        </time>
        <clef>
          <sign>G</sign>
          <line>2</line>
        </clef>
      </attributes>
      <note>
        <pitch>
          <step>C</step>
          <octave>4</octave>
        </pitch>
        <duration>4</duration>
        <type>whole</type>
      </note>
    </measure>
  </part>
</score-partwise>

————————————————————————————-

MusicXML is proprietary format (it is a product, registered and with an owner: it is not available to be modified by users, unlike open source software), although it is freely available under a public license. The main aims and background to the project are quite succinctly provided in the FAQs on the MusicXML website – but simply put, the goal is to provide a format which will enable notated music files to be transferred between programmes. Otherwise, just as with text based products like Microsoft Word, files created in one product are difficult/impossible to open and edit in others – in fact sometimes even between different versions of the same product (older and newer versions for example). Having used Sibelius (one of the better known music notation programmes) for the last 14 years, since I was at school, I have kind of grown up with it – it is very useful. But, it has drawbacks – not least cost, which is major barrier to access (Sibelius 7, the most recent version, seems to be going for about £400+, admittedly less than I remember it used to be). As is common with all WYSIWYG systems (I imagine), you are also limited to the tools/functions the developers of the interface have given you. In Sibelius these are extensive, and much better than they used to be, but are still heavily biased towards a certain type of notation, which itself is heavily biased towards a certain type of music.  Also, unless you know someone else with the software, the only way to transfer scores is by turning the file into a PDF, with the result that the score can no longer (easily) be edited.

So, the MusicXML format allows transfer between programmes – and many of the main programmes support it (not just notation-centred programmes like Sibelius, Finale, and MuseScore but also sound based ones like Cubase). Is there any relevance to all I’ve just said to Library and Information Science though? Well, bringing the commentary full-circle, it was actually at work that I first encountered MusicXML (the colleague who mentioned it me that I mentioned at the start of this post). My colleague was working on a temporary project looking at the ways and means available/would be needed to collect notated music not just in hard, print copy, but in electronic format. To the limited extent this was already being done, it seems PDFs were the usual file format for collecting such material but with the (then) future of web archiving and non-print legal deposit looming large there were questions about other files formats and digital preservation that needed answering. It was in this context that MusicXML was mentioned – as a possible means of keeping documents in a form separate of individual programmes (and so having to have each of those softwares in order to view anything, and hopefully side-stepping the issue of files created in obsolete softwares).

Finally, as a slight aside to this aside, the potential for musicologists in MusicXML is also important. The structure of the language opens up new ways of analysing music, and new ways of creating digital, critical editions of musical texts, taking into account a variety of different sources.

This, as I say, is all an aside: back to the second of my three-parter on the databases RIdIM, RISM and Shazam next. That will follow soon….


Posted in DITA | 2 Comments

RIdIM, RISM and Shazam: invocations to the musical data gods – part 1

This is the first of three posts about three databases that deal, in different ways, with music – music either as a scholarly pursuit, a hobby/interest, or as a commodity….or, most likely (in some sense or another), all three. Following on (with a bit of a delay!) from the DITA lecture on databases and information retrieval systems, I’ll talk briefly about how (it seems) they work, and a bit about how they don’t.

My choice of the first database follows on from Stina Westman’s chapter in ‘Information Retrieval: Searching in the 21st –century’ (2009), which got me thinking about the nature of image searches on the internet.

RIdIM

The database of Association RIdIM (Répertoire International d’Iconographie Musicale) is, according to their website,

                “designed to facilitate discovery of music, dance and theatre iconography images by      registered researchers, and the description of such images by registered cataloguers.”

[access seems, in fact, to be free for all – not just for ‘registered researchers’]

In terms of use, the primary function would appear to be to either find information about images, or information contained within them. This information may be quantitative in the case of the former – what are the dimensions of x?; where can I see y?; who painted z? – or qualitative in the case of the latter – what did lutes look like in the 16th-century?; how was Brahms portrayed in images created in his lifetime?; what is a sackbut? (it’s this)

As users we can find items in the database by one of three ways:

i) a ‘simple search’ free-text box – a term placed in here will be searched for anywhere in all the records;

ii) an ‘advanced search’ box, where one of the defined fields (institution, place, description, instrument etc.) can be searched at a time, or

iii) browsing one of the available fields, in which case all results are listed in an order.

For cataloguers (anyone can catalogue for RIdIM, regardless of experience or location: registering enables you to enter other parts of the website, where an ‘item record’ form can be filled in. Records are then checked and edited centrally before appearing in the public database), data entry is also done by one of three methods:

i) selection from a drop down list of controlled vocabulary (e.g. the ‘item type’ field);

ii) entering terms from a list of authorised forms (e.g. in the ‘instruments’ field); or

iii) free text, allowing for some element of subjectivity and, perhaps, semantic meaning (e.g. in the ‘description’ field).

The first thing that strikes me when using the database is how text centred it is. To an extent this might be expected, as words are of course our primary means of expression and description, and in some cases the answers we are looking for might well be text-based anyway (the quantitative examples mentioned before). However, while some images of the objects are shown on the RIdIM record for the item itself, in other cases hyperlinks to content hosted on other sites (the National Gallery, for example) are provided – I guess this is an understandable way of side-stepping copyright/licensing issues. In some instances there is no image at all though, just a textual record of some of the image’s attributes. This proves a little frustrating, to me at least, although I guess it depends on your needs. A ‘simple search’ for ‘lute’ ended up with 332 results, only some of which, much further down the results screen, had images embedded – which would help an awful lot (unless you are looking for something specific). Having links to other sites that host the images is of course much better than nothing, but the user experience is a bit frustrating, with a new web-page opening every time you want to check an image. I recently came across the search engine Redz, which, while not particularly great in the results it returns, is interesting in that displays its search results as images of the web-pages (or images themselves, if you are searching for those). Most people are probably aware of Google’s image search and the never ending page of pictures it allows you to browse through as well. These provide much better browsing experience, although of course rely on the information that others’ have provided.

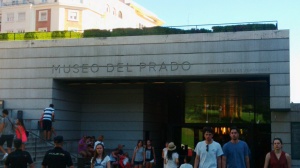
The real benefit of the RIdIM database is in its detailed, subject knowledge led focus though. An example is this Breughel picture held at the Prado in Madrid (I went there this summer, it was brilliant!).

A gratuitous picture from holidays to break up the text.

A gratuitous picture from my holiday to break up the text.

There is admittedly some duplication of information (dimensions, material, painter etc.) between the web-pages, but in terms of the contents of the picture, where description is always going to be subjective, the overview on each site comes from a slightly different perspective in both instances. The information contained on RIdIM is skewed heavily towards the subject in hand – musical iconography. While it does seem a shame that the entire painting has been boiled down to “one female playing rebec; two children singing” (mind you the Prado’s description is not that much less prosaic), the detailed listing of all instruments present, and even the inclusion of “illegible music notation” is a level of cataloguing both niche and invaluable.

While general images of lutes might be easier to browse and find through a search engine like Google, Bing, or DuckDuckGo, it is of course the case that they will only find images with the words that someone has chosen to attribute to them attached. The Prado web-page for the Breughel picture contains no mention of a lute (it’s not really that important in the grand scheme of the picture after all), so a search won’t find it.

But then the RIdIM database is far from comprehensive either. While it is still growing, it remains a time consuming, and arguably impossible task to catalogue and describe everything. In fact it’s similarly problematic to decide what ‘everything’ even is – at a recent conference I heard a very interesting paper talking about where to draw the line with the scope of the project – should things like photographs, videos and even tattoo art be included?

I’m starting to realise that information is a very messy thing – you can never get it neatly into the box you might try to put it in, there are always bits hanging out.


Posted in DITA | Tagged , , | Leave a comment

Embedded content from a Web service – the DITA Data Song

This post is a bit of a practice to see if I can successfully embed some content from a Web service – in this case SoundCloud. The content itself is a short piece of electronic music
created from the transformation of the module title (DITA) into pitches (as seen in the blog title picture above), and adding a few computer generated, and manipulated, sounds on Audacity. It’s maybe a bit 50s…

More posts to follow soon…

Posted in DITA | Tagged , , | 2 Comments

a few comments on blogs and appearance

As I get ready to leave for this morning’s DITA session (and have a bit of time to spare), I thought I’d post another entry focusing on the process of creating the blog and the last post – I realised, reading back through the the coursework guidelines, that I was supposed to have done this in the first place!

Even the first step of creating the blog, choosing a ‘theme’ to act as template for the page, proved problematic. A number of nice ones required payment, a number of free ones weren’t nice. Many looked cluttered. I chose the simplest, that still allowed for a banner picture at the top. My main aim was simplicity.

With customisation I encountered more problems: most of the better tools to customise also required payment. I kept it simple: a splash of colour round the edges and a picture at the top. Otherwise my instincts were to a simple, clean, home-made looking design.

The banner photo is my own (sidestepping the problem of looking for copyright-free images), and will be elaborated on in future posts. It is just another representation of the letters from the module title, using  notated pitches as equivalents.

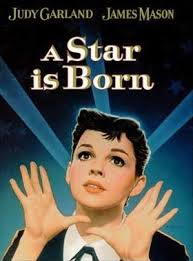
Posting the blog was less difficult (once it was actually written), although I was in a bit of a quandry over the use of the ‘A Star is Born’ film poster image. On one hand I felt a picture was needed to enliven the long text, on the other I’m not sure if I’m allowed to use this particular one. After some online reading, including on Wikipedia, relating to their use of these images (and indeed this one in particular) under fair use/dealing I decided to go with it. Quite happy to take it down if requested though! 

The blog process was fairly straightforward, although the frequent attempts to persuade you to ‘upgrade’, ‘go premium’ etc. is a little annoying. I need to investigate further the issues with differeing displays on different devices (viewing this on my mobile suggests a completely different blog for example) – I hope that might be the subject of a future post.

A rationale for the blog as a whole can be read on the ‘About the Blog’ page, but in short this is meant to be an accompaniment to the DITA (Digital Information Technologies & Architectures) module in the City University MSc in Library Science. Unlike previous blogs I’ve started and then never used again, this will [has to] include regular updates and posts – so make sure you visit again!!


Posted in DITA | Tagged , , , | Leave a comment

a blog is born

Out of desperation to find a way to begin, I typed the slightly lame title you see above: ‘a blog is born’. It serves its purpose. Soon after I found myself thinking of an image from the 1954 Judy Garland film, ‘A Star is Born’ – and soon after that I gained an accompanying soundtrack in my head.

Judy Garland in 'A Star is Born', 1954 - from http://en.wikipedia.org/wiki/A_Star_Is_Born_(1954_film)

Judy Garland in ‘A Star is Born’, 1954 – from http://en.wikipedia.org/wiki/A_Star_Is_Born_(1954_film)

From there I made the leap to the musical ‘Gypsy’ which, I remembered, is on at Chichester Festival Theatre at the moment, with Imelda Staunton as ‘Mama Rose’. I probably made this leap because there is a fantastic video of Liza Minnelli performing a song from the show I’ve watched a few times on YouTube. At this point I reminded myself that I must phone my mum this weekend. And so, I realised, I had the opening of my first blog post.

A network of connections in my mind produced the chain of images above, and allows it generally to jump from one thing/thought/idea to another in a more or less apparently random way (the connections above are perhaps more obvious: there are times when the link between thinking one thing and thinking the next has been far less clear).

At a more fundamental level it seems that these connections are not just a means of moving from thought to thought, but perhaps the whole basis of meaning. One of the texts on reading list for DITA, Tim Berners-Lee’s ‘Weaving the Web’ (1999), includes a passage that particularly struck me:

“In an extreme view, the world can be seen as only connections, nothing else. We think of a dictionary as the repository of meaning, but it defines words only in terms of other words. I liked the idea that a piece of information is really defined only by what it’s related to, and how it’s related. There really is little else to meaning.” – Berners-Lee, Tim with Fischetti, Mark ‘Weaving the Web’ (1999) , p.12

Assuming we agree with this (I think I do), why do we find it necessary to order anything in the traditional hierarchical way? In the LIS Foundation module, we saw last week that collecting and ordering information in the form of documents has been going on for thousands of years (I suppose the question of why we feel the need to produce documents at all is one that might be worth looking into – I think this may be covered in later parts of the course though, so I’ll hang on until then). The idea of having a definitive collection of all the world’s knowledge in one place seems to be a recurring motif throughout the centuries.

But isn’t there a form of hierarchy going on in thought as well – why did I go to Judy Garland from ‘A Star is Born’ rather than Barbra Streisand’s 1976 effort? I guess it’s a more personal hierarchy in thought; the hierarchy sub-consciously deemed suitable for the particular need at hand, rather than a monolithic ‘one-size fits-all’ one (i.e. putting things in alphabetical order).

Interestingly, Berners-Lee talks of his vision of the World Wide Web being an analogy to the physiological human processes of thought – although it seems to have ended up a bit of a hybrid, with plenty of examples of traditional hierarchical ordering in place (the British Library’s website is as good an example as any – and a decent example of how that doesn’t always work). The DITA module, and Information Architecture generally, seems to be as much about looking at alternative ways to access and move between pieces of information in digital formats as about ordering them in the hierarchical ways we’re used to from analogue written forms.

I suppose analogue written forms come with their own implicit hierarchies. They are also already divorced from reality – just a representation of what we think. Digital information is of course also divorced from human reality, and is also a representation of thoughts and meaning. In and of itself it is at least neutral though, with on and off being two equal signals (I wasn’t sure about that, but realised it was the hierarchy implicit in the words ‘on’ and ‘off’ which was making me think one was superior to the other). It is an analogy for the signals being sent in the brain to form thoughts and mental images.

As we progress through the DITA module we’ll be looking at ways digital information can be used and manipulated to create structures – ultimately to help us better find things that we want (whether they are things we know we want or not). The article set as reading this week (Westman, 2009) about image searching shows a mixture of ways we might try to find images online. In a way, it does seem odd that traditional text based searches still seem to dominate, although with the use of free text and tags some of the most obvious hierarchies can be broken down. Possibilities such as searching by dominant colour, from a text-free palate that enables you to express something more specifically than you can in text take things a step further. More about this in weeks to come though.

I’ve been pondering and musing quite a lot here, although reading back it hits home once again that what I’ve written doesn’t really capture what I was thinking. Concepts I’ve tried to express in words (which after all are the most structured means we have for giving form to thought) have become static and corrupted, where they were in my mind more fluid and true. That is the nature of language I suppose; otherwise I would be having been swimming alone in Ferdinand de Saussure’s ‘shapeless and indistinct void’ of thought. Anyway, now I’ve just thought of another song from a musical I want to watch a clip of on YouTube.


Posted in DITA | Tagged , , , , , , , , | Leave a comment